

A3-02 Development of environmental assessment method for plastic resource recycling system
Principal Investigator
GENCHI Yutaka (National Institute of Advanced Industrial Science and Technology)
Research and Development Overview
In this research project, we collect key environmental and safety information on the characteristics of recovered plastics and processes for recycling them. Based on this information, we propose a method for calculating the carbon footprint (CFP) of the entire supply chain. Finally, we study how this information can be included in PLA-NETJ (Plastic Networking for Environmental Transformation Japan) with the aim of contributing to the social implementation of a circular economy.
For risk assessment, we identify additives, impurities, and contaminants in recycled plastic pellet samples (20 or more samples) and establish the maximum acceptable exposure levels for potentially hazardous substances. Additionally, we select one or more recycled plastic products in which polypropylene (PP) is the main polymer and develop a use scenario for a case study on exposure and risk assessment.
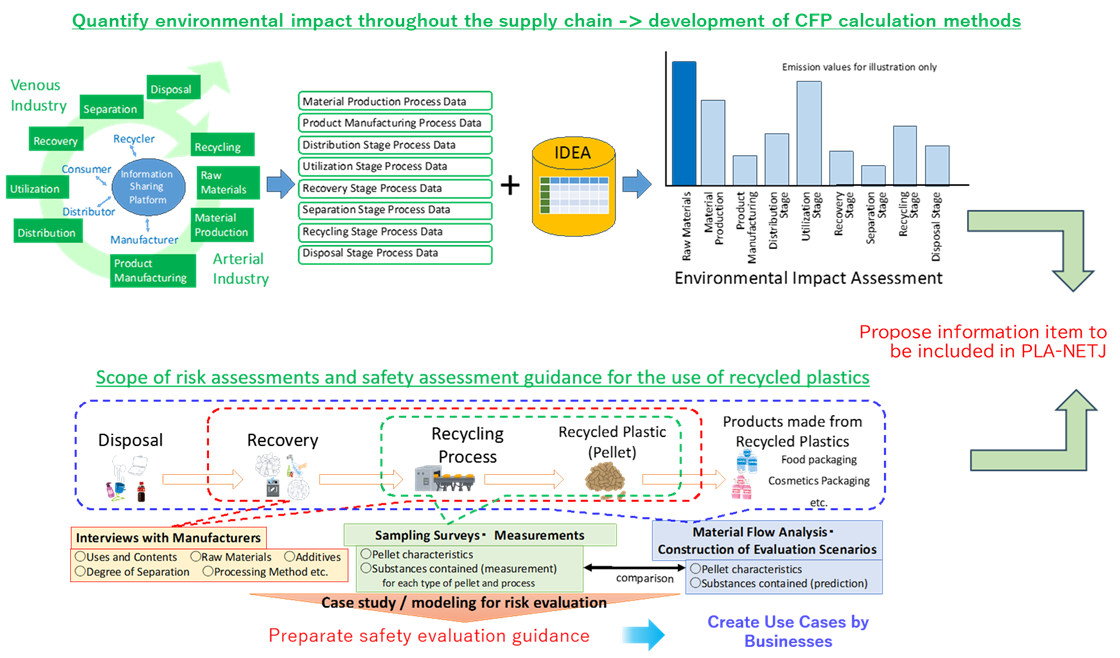
Figure.1 Overview of Research and Development
Progress and Achievements
Research Contents
- Data collection regarding the recovery and collection stages on the supply side, as well as recycling processes
- Based on data collected in FY2024 regarding the sorting, collection, and processing of plastic packaging waste from households in Kobe City, an inventory dataset was created to calculate the CFP. The CFP was calculated and compared for three scenarios: municipal collection (the municipal collection route for plastic packaging waste), community collection (the collection route for plastic packaging waste at resource recovery stations), and non-recycling routes (incineration and landfill). The main finding was that community collection resulted in lower GHG emissions than incineration.
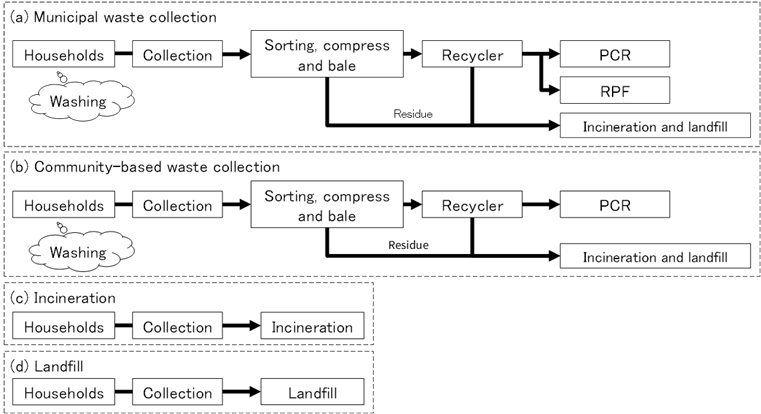
Figure.2 System boundary of each collection route
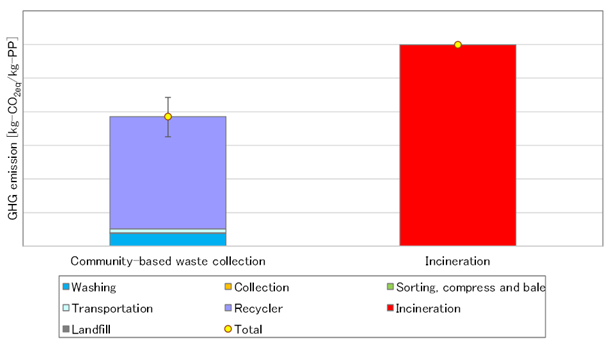
Figure.3 Calculated inventory data
- Based on data collected in FY2024 regarding the sorting, collection, and processing of plastic packaging waste from households in Kobe City, an inventory dataset was created to calculate the CFP. The CFP was calculated and compared for three scenarios: municipal collection (the municipal collection route for plastic packaging waste), community collection (the collection route for plastic packaging waste at resource recovery stations), and non-recycling routes (incineration and landfill). The main finding was that community collection resulted in lower GHG emissions than incineration.
- Case study in a model city
- A material flow analysis was conducted on PP packaging plastic waste generated by households in Kobe City to determine the volume of PP packaging plastic purchased as products and the volume of waste by collection route. The majority of PP plastic packaging waste is currently collected through municipal collection routes, while community-based collection remains limited. An increase in the number of community collection sites is expected to lead to a rise in the volume of waste collected through community-based collection in the future.
- Scenarios were developed for five PP product categories by collection route to evaluate the relationship between GHG emissions and household required washing time. The following scenarios were established: Current Situation (a scenario based on the current practice of combining municipal and community collection), Municipal Collection (a scenario where all PP packaging plastic waste is collected and recycled exclusively through municipal collection), Community Collection (a scenario where all PP packaging plastic waste is collected and recycled exclusively through community collection), and Incineration (a scenario where all PP packaging plastic waste is incinerated and not recycled). GHG emissions were calculated for each scenario. Furthermore, we assumed that household plastic packaging is washed during sorting and therefore included washing time as an evaluation metric. The main findings indicate that while the community collection scenario is expected to yield significant GHG reductions, household washing times increase to achieve high-quality plastic recovery. Discussions must consider not only CFP perspectives but also the burden on residents regarding washing and segregation.
- We surveyed Kobe residents to identify the values consumers prioritize when purchasing recycled plastic products. Values associated with recycled plastic products were categorized into 15 items, including “lightweight,” “sturdy,” “durability,” “environmental labels,” and “product collection and recycling programs.” Questions combining these values were created, and the structure was presented to respondents. They were asked which values they prioritized most, and the priority of each value was quantified using a weighting system. The results showed that for hygiene products made from recycled plastic, “hygiene,” “safety,” and “price” were particularly important. For automotive parts made from recycled plastic, “safety,” “quality,” “price,” “durability,” and “sturdiness” were particularly important. It is believed that emphasizing that recycled plastic products ensure safety and possess quality and durability equivalent to virgin materials will lead to increased consumer confidence and a greater willingness to purchase.
- Acquisition of process data of waste plastic recycling
- We conducted process simulation to acquire data of waste plastic recycling process in Kobe city and estimate its CFP.
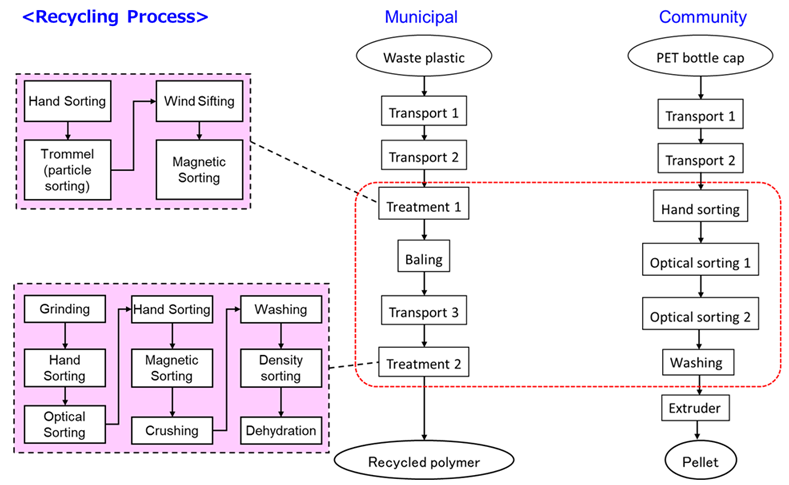
Figure.4 Waste plastic recycling process in Kobe city
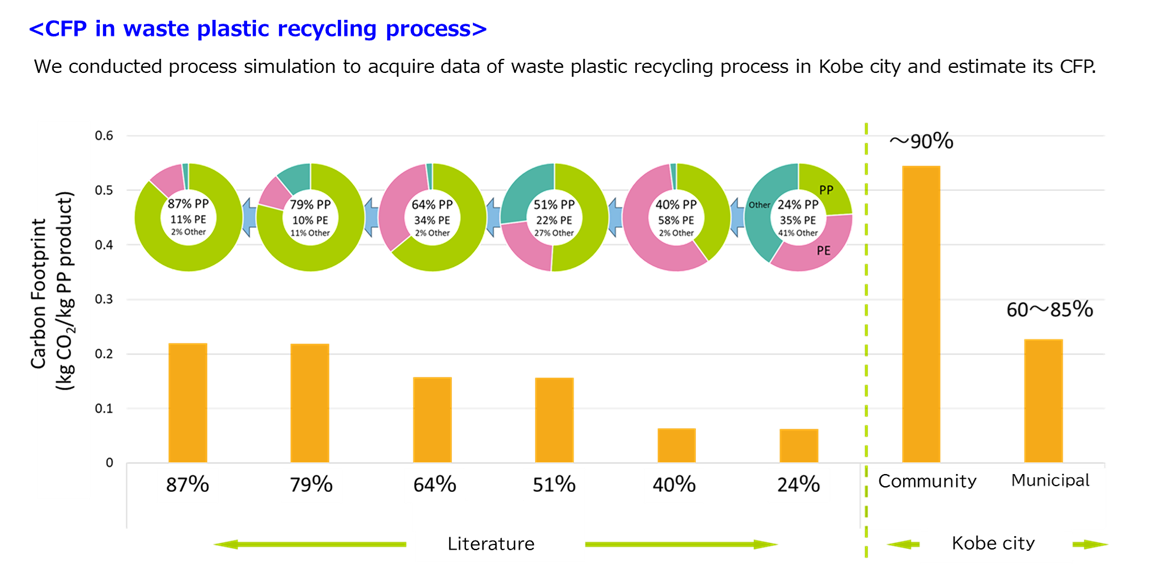
Figure.5 CFP in waste plastic recycling process
- We conducted process simulation to acquire data of waste plastic recycling process in Kobe city and estimate its CFP.
Safety evaluation
- Identification and quantification of substances in recycled plastics
Additives were extracted from resins by heating 44 types of recycled plastic pellets, independently obtained from the market, in cyclohexane at 140 °C for 4 h. The extracts were then re-precipitated in methanol and concentrated under a nitrogen stream. Eight antioxidants and eight UV absorbers in the extracts were analyzed by GC–MS.
Antioxidants were detected more frequently and at higher concentrations than UV absorbers. The most frequently detected antioxidant was pentaerythritol tetrakis[3-(3,5-di-tert-butyl-4-hydroxyphenyl) propionate] (Irganox 1010), found in 98% of the samples (0.3–403 μg/g). Octadecyl 3-(3,5-di-tert-butyl-4-hydroxyphenyl) propionate (Irganox 1076) was detected in 39% of the samples (<2.0–>265 μg/g). 2,4-di-tert-butylphenol (Prodox-146) and butylated hydroxytoluene (BHT) were detected in 34% (<0.3–39.3 μg/g) and 14% (<0.3–83.2 μg/g) of the samples, respectively.
Among the UV absorbers, UV770 was detected in 6.8% of the samples (<3.5–76.5 μg/g), whereas UV327 and UV329 were each detected in only one sample (48.6 and 1.14 μg/g, respectively). The EU’s amended Regulation on Persistent Organic Pollutants stipulates that, by August 4, 2029, UV328 in recycled products must be limited to <1 μg/g as an unintentional trace contaminant (UTC). All pellets analyzed in this study met this requirement, as UV328 concentrations in all samples were below the limit of quantification (0.3–0.7 μg/g). Other UV absorbers, including UV-329, UV-320, and UV-350, which have been designated as Substances of Very High Concern (SVHCs) in Europe, were detected at measurable concentrations in only a few samples.
- Case study of risk assessment of hazardous substances in recycled plastics
We present the framework for the current risk assessment in Fig. 6. Our risk assessment utilizes the hazard quotient as an initial screening method, which compares the estimated exposure of a target substance with its acceptable dose. If the estimated exposure is lower than the acceptable dose, the hazard quotient is also below 1, indicating that the substance's risk is considered acceptable. In the current case studies, we selected substances regulated under the RoHS directive* that are of high interest to nearly all companies involved in the import and export of plastics. As sample polypropylene products under SIP, we chose (1) the plastic holder of nail clippers and (2) plastic button panels used for opening and closing car windows. We established use scenarios by considering factors such as contact duration and surface area for both target substances and products, then set the necessary parameters for the exposure assessment tool. To determine substance concentrations in recycled plastic products, we reviewed approximately 100 previous studies analyzing these substances and applied the highest measured concentrations from these studies in our exposure assessment. Even under conservative risk assessment conditions—accounting for all combinations of products, scenarios, and substance concentrations mentioned above—the estimated exposures did not exceed the acceptable dose. Therefore, we conclude that the health risks associated with these substances in recycled plastics are negligible.
* The RoHS (Restriction of Hazardous Substances) Directive
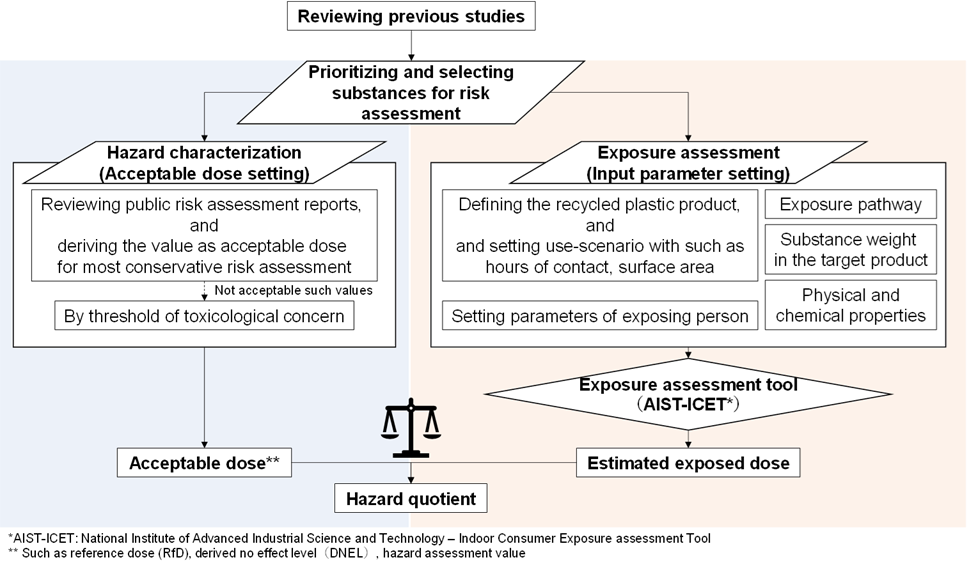
Figure 6. Risk Assessment Framework for current case studies